What is volatility?
Volatility is the ability to change rapidly and unpredictably. In financial markets, volatility represents how large an asset’s prices swing around the mean price. In layman’s term, its basically how much the price of any particular asset has moved up or down over time. A market is considered volatile if it rises or falls more than 1% over a given period.
Types of volatility
Volatility can be calculated in many ways but here are two of the most popular used types:
- Historical volatility
- Implied volatility
Historical volatility
Historic volatility is the standard deviation of the change in price of a stock or other financial instrument relative to its historic price over a period of time ( often 30 days or a year). This volatility does not take market direction into consideration and provides data that is backward-looking.
Implied volatility
Implied volatility is closely associated with options trading. It is what the market is expecting to be in the future. The options market is a bid and offer system in which buyers and sellers come together in an auction environment to actuate price discovery and execute trades. This concept also gives traders a way to calculate probability because its’ forward-looking calculation allows investors to estimate where the market is headed.

Calculating Volatility
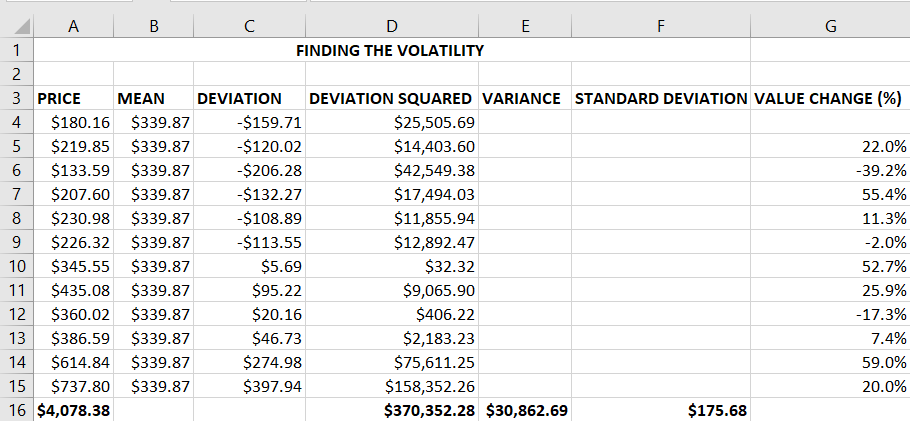
Calculating volatility is often done using variance and standard deviation. Standard deviation is the square root of the variance.
- Gather the previous closing (daily/monthly) prices.
- Calculate the mean price of the data set found in step one. By adding $180.16, $219.85, $133.59 all the way to $737.80, we get $4,078.38. This number is then divided by 12 because we have 12 numbers in our data set. This provides a mean or an average price of $339.87.
- Determine the deviance. This is the difference between each data set and the mean price. Example, $180.16 - $339.87 = -$159.71, $219.85 - $339.87 = -$120.02. This continues all the way to the last data of $737.80.
- Squared the differences from the previous step. This will eliminate any negative value.
- Find the sum of the squared deviation ($370,352.28).
- Divide the sum of the squared differences by the total number of prices in the data set ($30,862.69).
- Calculate the square root of the number obtained in the previous step.
A disadvantage of using standard deviation to calculate volatility is that the measurements are based on the assumption that returns are normally distributed. With normal distribution, also known as a bell curve, more results cluster near the center and fewer results are significantly above or below average.
Volatility in Crypto
Crypto is a fairly new asset class which is just over a decade old. It has had its’ fair share of volatility, similar to the stocks but is considered to be more volatile. With that said, several things can contribute to the wild up and down swing in the price of a crypto assets such as Bitcoin (BTC), Ethereum (ETH), XRP (XRP) and Intercoin (ITR). These include but aren’t limited to:
Price Discovery Stage
As of writing this article, there are approximately 15,502 cryptocurrencies that exist today according to CoinMarketCap, With new cryptos being created on a frequent basis. As a result of this newness, the crypto asset, market as well as investors/speculators are still trying figure things out so it is still the initial stages of price discovery. The price discovery process looks at factors such as investor risk attitudes and supply and demand to see where a buyer and seller agrees on a price in order for a transaction to take place.
Speculation
Speculation is simply forming a theory or conjecture without firm evidence. There are many reasons why investors speculate on an asset. With Bitcoin for example, investors theorize that the price would go up or down with the hope of making a profit. This cause a sudden influx or outflow of money leading to high volatility. In the past, investors had speculated on China banning Bitcoin, a Bitcoin ETF approval by the SEC, Bitcoin being used as a hedge against inflation and last but not least, institutional investors investing in Crypto assets.
Fragile Investors
Many investors are lured into investing in crypto by the thought of making a lot of money and in a short amount of time. This however, is not always the case. As a result, they end up losing interest and withdrawing their investment which usually cause price swings in that particular asset.
Tracking Crypto volatility
If you are curious about keeping an eye on the volatility of a particular crypto asset, there are websites out there that have already done it for you.
Can volatility be reduced in Crypto?
For some investors, the volatility is what brought them to crypto in the first place because they can take advantage of the wild swings. For investors with less risk-tolerance, there are strategies that can be utilize to reduce exposure to downward volatility. These are: Setting stop-limit order, dollar-cost averaging or hold your money in Stablecoin cryptos such as USDT or USDC. Stablecoins are designed to be pegged to a reserve asset such as the U.S dollar.
